Menu
Home
Training Director Profile
Services
Biostatistician
Skills Set
Training Curriculum
SAS Statistical Programmer
Skill Set
Entry level Training Curriculum
Advance Training Curriculum
Learn Right
Biostatistician
SAS Statistical Programmer
TLG Samples
Contact Us
TLG Samples
Back to Table Of Content
Previous
Next
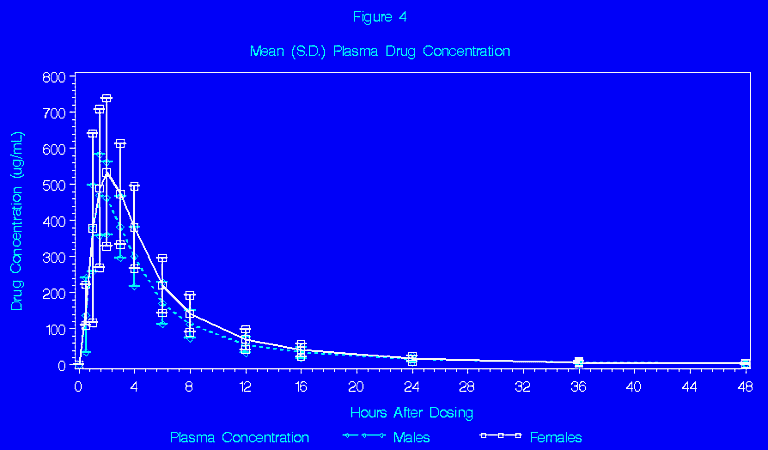
Plot of Plasma Drug Concentration at 0 to 72 Hours After Dosing in PK Studies (Mean and S.D. plotted at each point using annotation data sets in SAS)